
Lecture 2
The Polygraph and Digital Polysomnography
Derived from the Greek roots poly, meaning "many," somno, meaning "sleep," and graph, meaning "to write, record" the polysomnograph is a multichannel recording instrument (polygraph) designed to document a variety of physiological activities during sleep, producing a synchronized recording called the polysomnogram.
The polygraph is a collection of amplifiers with an input mechanism (the jackbox and input selector), filters, sensitivity or gain settings, and a recording mechanism (computer). The majority of polygraphs have a minimum of 16 channels, although the number of channels can range from 16 to 64, or more. Most clinical polysomnograms result from the information transmitted from a minimum of 16 channels recording signals received from EEG, EOG, EMG, respiratory airflow and effort, EKG, and ancillary equipment. Ancillary equipment, such as oxygen saturation, carbon dioxide (CO2), and pH monitors, is routinely interfaced with the polygraph to produce a complete, time-linked recording for later analysis.
Most of the recorded signals are input via the instrument jackbox. Most jackbox inputs are labeled with the International 10–20 System electrode designations for EEG, while additional channels are typically labeled with numbers. Since the EEG recorded for polysomnography generally consists of only six channels, the electrodes and sensors used for recording additional signals monitored during polysomnography (such as EOG and EMG) are also interfaced through the instrument jackbox. These signals are input using both the jacks labeled for EEG and the additional numbered jacks.
Each pair of electrodes (called a derivation) used to record a particular signal is routed to an amplifier for processing. The instrument provides an input designation mechanism that allows the technologist to designate from which electrode jacks the signal will be input to each channel. For example, if the ROC (right outer canthus) EOG electrode is plugged into the jackbox at P3 and is referenced to M1, then P3 must be input as input 1 and M1 as input 2 on the channel that will be recorded as right EOG. Each channel of information to be recorded must be designated on its corresponding amplifier. The instrument must be calibrated for each channel of information that will be recorded. Calibration is performed to confirm and document that all electrodes, sensors, and amplifiers are operating correctly before beginning the recording, and to ensure the reliable representation of the incoming biophysical signals.
Alternating current (AC) amplifiers are used to process the majority of the recorded signals including EOG, EMG, and EEG. The amplifier increases the voltage of the generally very small, rapidly fluctuating, incoming signals. The AC amplifiers used for polysomnography are differential amplifiers that amplify the difference between two inputs and, by cancellation, eliminate identical signals occurring at both inputs. This is known as common mode rejection. AC amplifiers used in EEG and polysomnography use high input impedance to prevent distortion of the EEG signal.
Polarity determines the direction in which the signal will display in relation to baseline. By convention, the polarity of the amplifier output is such that a negative potential difference will cause an upward signal deflection, while a positive potential difference will cause a downward signal deflection. In general, input 1 (or grid 1) of the differential amplifier is the active (or recording) electrode and input 2 (or grid 2) is the reference electrode (see fig. 2.1).
Figure 2.1.

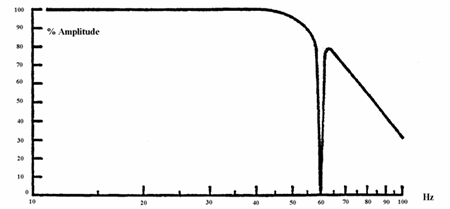
AC amplifiers are equipped with circuits to filter out unwanted signals. Both high frequency filters (HFF) and low frequency filters (LFF)or time constant (TC) filters are available in an AC amplifier. In addition, most AC amplifiers have a 60 Hz "notch" filter. This notch filter is not used routinely in EEG recordings, since it can potentially camouflage a bad signal or unstable electrical environment. It is only used when absolutely necessary.
There are two types of direct current (DC) amplifiers. The standard DC amplifier used in polysomnography is a single-ended amplifier, which amplifies the difference between a single input and ground. DC amplifiers have no LFF or TC filter to filter out lower frequency signals. Therefore, the output reflects undistorted input signals. Standard DC amplifiers are used to record slowly changing signals, usually input directly to the amplifier from an ancillary source such as the relatively constant voltage output of an oximeter or capnograph. Direct current amplifier polarity determines the direction of signal movement. On most systems the channel polarity can be changed or reversed. It is essential to verify that increasing voltages move the tracing above, and not below, the baseline.
The second type is a differential DC amplifier, which works similarly to an AC differential amplifier. Differential DC amplifiers have a balance control used to balance input signal voltages between two inputs and may have either a built in or user selectable HFF. These DC amplifiers also have a polarity setting similar to that on a standard DC amplifier. Differential DC amplifiers can be used to record slowly changing signals, such as those from respiratory strain gauges, but are rarely used for polysomnography today.
The high frequency filter, used to attenuate or reduce signals above the "cutoff" frequency, is measured in Hertz (Hz), which is set on the amplifier. The reduction is not a sharp cutoff but is a gradual cutoff beginning prior to the filter setting and increasing in attenuation as the recorded frequency increases. The rise time constant is controlled by the HFF setting of the amplifier. This is the time, in seconds, that it takes for the signal to rise to 63 percent of its maximum deflection when a square wave signal (the calibration input) is applied to the input terminals of the amplifier. At a particular HFF setting, incoming frequencies at the set cutoff frequency are attenuated by a designated percentage, which is manufacturer specific. Incoming signals of higher frequency are attenuated even more dramatically. In most cases, this is 20–30 percent of the HFF setting. This means that, as the frequency of the incoming signal increases, it is progressively decreasing in amplitude. The high frequency filter is sometimes called a "low pass" filter because the filter will allow low frequency signals to pass unaltered. This can be illustrated by the frequency response curve, which visually graphs the degree of attenuation at a given frequency at a particular HFF setting (see fig. 2.2).
Figure 2.2.
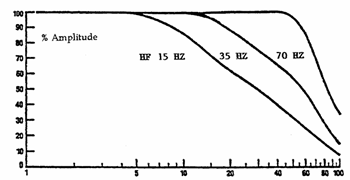
Note that when the HFF is set, for example, at 60 Hz, frequencies of even 50 Hz are significantly attenuated. Lowering the HFF setting from 35 Hz to 15 Hz can seriously distort EEG frequencies close to the 15 Hz setting, such as sleep spindles. The HFF should never be lower than 35 Hz, and a 70 Hz HFF setting is recommended for recording EEG activity in patients with suspected seizure activity. There is virtually no distortion of EEG signals at an HFF setting of 70 Hz, since these usually range in frequency from 0.3 to 25 Hz. Note that an HFF setting of 35 Hz is standard for PSG recordings.
The low frequency filter is used to attenuate or reduce signals below the cutoff frequency, which is also measured in Hz. At a particular LFF setting, frequencies below the cut off frequency are attenuated by a designated percentage, generally 20 percent. You should know the specifics of your instrument in terms of the cutoff percentage used, since this varies by manufacturer. Again, the signal amplitude decreases as the frequency approaches the cutoff frequency. The low frequency filter is sometimes called a "high pass" filter, since it will allow higher frequencies to pass unaltered. The degree of attenuation or amplitude decrease at a particular frequency can be mapped on a frequency response curve (see fig. 2.3).
Figure 2.3.
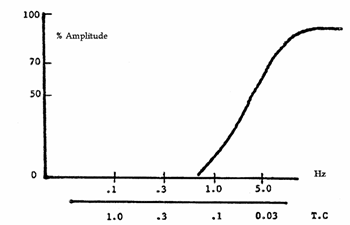
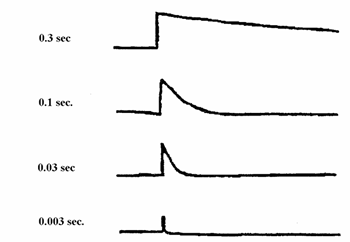
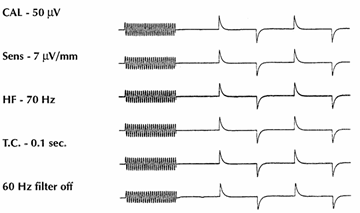
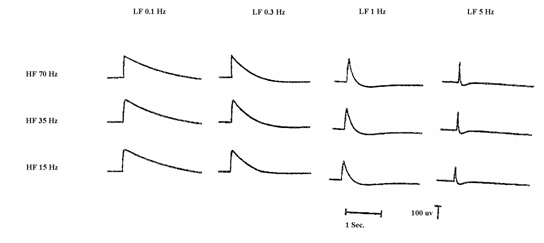
The LFF is sometimes labeled TC or time constant, which is measured in seconds. The LFF circuits in some instruments are labeled in both Hz and seconds. Low frequency response is related to fall time constant, which is the time, in seconds, that it takes for the signal to decay to 37 percent of its initial amplitude when a square wave signal is applied to the input terminals (see fig. 2.4). As the time constant is increased, the time it takes for the square wave to return to baseline is increased, and as the time constant is decreased, the time it takes for the square wave to return to baseline is decreased. Conversely, when using LFF (labeled in Hz), a filter setting increase (e.g., from 1 Hz to 5 Hz) will result in a decrease in the time it takes for the square wave to return to baseline. With a decrease in the LFF setting (e.g., from 1 Hz to 0.5 Hz), the time it takes for the square wave to return to baseline is increased. In other words, the longest time constant corresponds to the lowest low filter setting. Therefore, increasing the time constant, or decreasing the LFF setting, will result in less distortion of slow signals. The time constant also affects the calibration signal amplitude. The longer the time constant, the greater the amplitude of the calibration signal. Shorter time constants will result in a decrease in the calibration signal amplitude. See figure 2.5 for a sample of the effects of different time constant signals on the calibration signal. Calibration should be performed using a long time constant and high HFF setting to provide an accurate representation of the effects of the instrument settings on the calibration signal.
Figure 2.4. Time constant (in seconds).
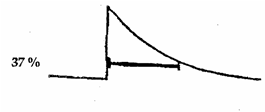
Figure 2.5.
In addition to the HFF and LFF filters, most amplifiers have a 60 Hz notch filter designed to filter out a narrow band of frequencies at, or close to, the 60 Hz power line frequency common to all electrical devices in the United States. (Outside of the United States, power line frequency is 50 Hz and notch filters are designed to filter out a narrow range of frequencies at, or close to, 50 Hz.) Although this filter is designed to attenuate only a narrow frequency band, it does, to a degree, affect frequencies close to 60 Hz and should not be used except when other measures to eliminate 60 Hz interference are ineffective (see fig. 2.6).
Figure 2.6.
AC amplifiers also have a sensitivity setting that controls the ratio of the input signal to the output signal recorded at the pens. Sensitivity, which is the ratio of input voltage to the amplitude of the signal deflection, literally makes the amplifier more or less sensitive to voltages. If activity that comes into the amplifier is of such high voltage that the pens block (either square off or the signals run into each other), the output (recording) is no longer accurate. The opposite can happen as well. The signal may be so small that the features (frequency and wave morphology) cannot be seen. In the first case, the sensitivity is set too high; in the second case, the sensitivity is set too low. Sensitivity is measured in microvolts per millimeter (µV/mm) and in some cases in millivolts per centimeter (mV/cm). During calibration the sensitivity is adjusted, based on the calibration input voltage, to produce a measurable signal on the polygraph (see fig. 2.7).
Figure 2.7.
The tracing or "write-out" system used in most PSG instruments dictates the upper and lower level of sensitivity that can be used to accurately record activity on paper. This is called the dynamic range of the system. It is a way of describing the relationship between the amplifier's sensitivity level and the signal's mechanical, or physical, limits. In a computerized system, the signal limits are digital settings as opposed to mechanical limits. Even in a digital system, the tracing can be forced to move only so far before it will square off and, thus, not record accurately. When this happens, it is necessary to decrease the sensitivity of the amplifier so that less signal deflection will be required to represent more voltage. Very low voltage activity needs to be amplified enough so that the frequencies and waveform shapes can be recognized. Thus, the lower end of the dynamic range is important as well. If it is difficult to count frequencies because the signal's movements can hardly be seen, the sensitivity needs to be increased so that more signal deflection will occur in response to less voltage.
A generally accepted "rule of thumb" regarding what sensitivity should be used is that tracing should reflect around 5 to 10 millimeters most of the time. A sensitivity of 7 µV/mm will adequately record most normal background EEG activity, since it has a voltage of around 40–80 µV. Electroencephalogram sensitivity during PSG recording is usually set at 5–7 µV/mm in adults and 10 µV/mm in children, due to their higher voltage EEG activity. Sensitivity of other PSG parameters is determined by the voltage of the signal to be recorded. Sensitivity should be adjusted to prevent signal blocking and provide an adequate signal for scoring sleep stages. Most PSG instruments have a wide range of sensitivity settings, from 1 µV/mm to 300 µV/mm (Note: the smaller the µV value the more sensitive the amplifier). To calculate the voltage of any electrical discharge, one must know what sensitivity setting was used while recording the activity.
Phase shift, or a shift in time of the appearance of a recorded waveform, can also be affected by filter settings. The LF filter produces a shift to the left, or earlier in time, in addition to attenuation of frequencies close to the cutoff frequency. The HF filter, again along with attenuation, produces a shift to the right, as the input frequency approaches the cutoff value. See figure 2.8 for a display of the effects of various HFF and LFF settings on the calibration signal.
Figure 2.8.
Computerized polygraphs have largely replaced standard polygraphs. Some systems use an analog-to-digital converter to link analog amplifiers to a computer. Most systems today use digital amplifiers connected directly to a computer in conjunction with ancillary equipment linked via an analog-to-digital converter to record a digital polysomnogram. However, the use of a computer does not lessen the need for understanding standard instrumentation principles. In fact, the use of a computer requires that the technologist be knowledgeable enough to determine if the computer is adequately and accurately recording the variety of biophysical signals recorded during a polysomnogram.
Proper electrode and sensor application technique and precise equipment calibration remain essential. Accurate signal processing must be ensured, as well as artifact recognition and recording maintenance. The use of systems with direct digital amplifiers requires excellent electrode application technique and backup channels, as most of these systems do not provide the ability to re-montage during the recording.
Digital amplifiers use a common reference to which all amplifiers are connected via a common reference electrode. The common reference electrode acts as a reference point. Whereas in traditional differential amplification the difference between electrical activity at each input is recorded, digital differential amplification works a bit differently. With digital differential amplification, the system records the electrical value at each data point of the electrode pair and compares it to the electrical value at the common reference electrode. The value of activity at the common reference electrode is removed from the value of the activity between any pair of electrodes and thus has no effect on waveform amplitude or polarity. This allows re-montaging or changing the activity displayed after the recording by using a different pair of electrodes.
Mathematically, this is how it works.
The traditional differential amplifier records the difference between electrical activity occurring at two different inputs (electrodes).
|
Electrode 1—records a positive 40 µV signal |
|
40 µV |
|
Electrode 2—records a positive 20 µV signal |
|
20 µV |
|
The difference is recorded as a positive 20 µV signal |
|
20 µV |
The digital differential amplifier records the electrical activity occurring at each of two inputs (electrodes) and compares each to the common reference electrode.
The common reference electrode records a positive 10 µV signal
|
Electrode 1—records a positive 40 µV signal |
|
40 µV – 10 µV = 30 µV |
|
Electrode 2—records a positive 20 µV signal |
|
20 µV – 10 µV = 10 µV |
|
The difference is recorded as a positive 20 µV signal |
|
20 µV |
Digital instrumentation does not change the standard polarity convention. A negative potential difference will cause an upward signal deflection, while a positive potential difference will cause a downward signal deflection.
Digital DC amplifiers use the same principles as standard DC amplifiers; recording between a single input and ground and reflecting undistorted input signals.
Analog-to-digital (A to D) conversion is used to digitize continuously varying biophysical signals, which are then stored on the computer for review and scoring. The sampling rate of the analog to digital converter determines the horizontal frequency resolution of the recording signals. Each signal is sampled at a particular rate based on the resolution required to adequately represent it on a computer screen. This is based on the Nyquist sampling theorem, which states that the sampling rate must be at least twice the frequency that you want to record in order to adequately represent the data. Aliasing occurs when the sampling rate is inadequate to reproduce the signal being sampled. Aliasing affects fast signals more significantly than slow signals. For example, if you were to sample a 10 Hz EEG signal using a sampling rate of only 5 Hz, you would seriously distort the waveform and produce a false slowing in the EEG signal. In other words, the 10 Hz EEG signal would appear as a 3–4 Hz EEG signal due to the use of an inadequate sampling rate.
In general, proper frequency resolution requires at least two sampling points per cycle of activity, although current systems frequently sample at higher sampling rates. For example, faster activity such as EEG at up to 30 Hz for beta activity requires more data to be sampled and recorded than respiratory data at about 12/minute or 0.2 Hz. Because of this, an EEG signal typically requires a much higher sampling rate than slowly changing uncomplicated signals such as respiratory effort or an oximetry tracing. The higher the sampling rate, the more accurate the digital recording will be. To accurately record a complex EEG signal, a sampling rate of at least 200 samples per second is required. In some instruments, data is sampled at 500 samples per second and stored at 250 samples per second. The use of a higher sampling rate helps to prevent signal phase distortion.
Slowly changing respiratory signals can be adequately recorded and displayed with a sampling rate of 25 samples per second, while signals such as oximetry or pH may be sampled at as low as 12.5 samples per second. Adequate resolution of the EKG can be obtained with a sampling rate of 125 samples per second. In general, no information will be lost during analog to digital conversion if the sampling rate is at least double the frequency of the signal to be digitized.
Amplitude resolution is based on the number of bits per sample used to represent each digital value. One byte (8 bits) can represent 256 values (+/– 128 µV) at one microvolt resolution. One byte is sufficient to accurately represent EEG data in conjunction with a sufficiently high sampling rate; however, the minimum digital resolution currently considered adequate for computerized polysomnography is 12 bits per sample. In most computerized systems the actual digital resolution is significantly higher, with current technology usually 32 bits per sample. The higher the bit rate, the better the amplitude resolution.
The display resolution of the monitor on which the data is reviewed must also be sufficient to accurately visualize the frequency and morphology of the waveforms recorded. A high resolution monitor is required for accurate data representation. Display resolution is based on the number of pixels per inch or millimeter (mm), and a minimum of 2 pixels/mm is necessary for adequate screen resolution of the EEG signal. The higher the number of pixels per inch or millimeter, the better the screen resolution. Data displayed on a computer used for scoring should appear identical to the same data acquired on a conventional polygraph, in terms of waveform morphology, and voltage and frequency measurements. The computer must be able to display the various channels of PSG data in a manner that permits accurate scoring of sleep, respiratory and other parameters.
A routine polysomnograph is routinely recorded using a 30 second epoch size. To determine the frequency of any given electrical activity, one must know what epoch size is displayed. Frequency, remember, is measured in cycles per second, so to calculate the frequency of a given activity, simply count the number of waves that are seen during one (1) second on the display screen.
One of the benefits of digital instrumentation is the ability to change the time base to suit specific display needs. Sometimes, it is beneficial to view data using a different epoch size. Clear visualization of respiratory patterns, which are relatively slow signals, is best at an epoch size of 120 seconds. If suspected seizure activity is seen, the epoch size should be changed to 10 seconds in order to better visualize the EEG activity.
Changing the epoch size from 30 seconds to 10 seconds "spreads out" the electrical potentials and makes it easier to count the fast frequencies. For example, sometimes 60 cycle interference is confused with high frequency muscle activity. The 60 cycle artifact is very sinusoidal and regular, whereas muscle activity will be sporadic and of mixed frequencies. Counting single waves of such high frequencies is nearly impossible with the unaided eye, but if the epoch size is decreased, this becomes much easier. Changing epoch size does not change the activity being recorded, it only changes the way it appears on the page. Changing epoch size is an effective way to enhance the visual images on the page, and it should be used to investigate unusual circumstances.
During data acquisition, screen resolution may be of somewhat lower quality in some digital recording systems. It is essential that screen resolution during data acquisition be sufficient to determine the quality of the recording and the sleep stage. In addition, it is essential to be able to review previously recorded data during ongoing data acquisition. In most systems, a split screen or look-back window can be used to view previously collected raw data. This is similar to looking back at previous pages during a paper PSG recording. Some systems provide a trend of the previously recorded SaO2 or heart rate data as an additional look-back function, which may be useful during CPAP or oxygen titration.
Digital systems actually record all signals with the filter settings relatively open to allow for postrecording filtering. Sensitivity settings, on the other hand, must be set within appropriate recording parameters. During the recording and review processes these instruments use a gain setting to allow changes in the display size for better visualization of waveforms and activity. Similarly, epoch size can be changed both during the recording and review processes without affecting the underlying recorded data.
Data storage must be reliable and safe, especially when there is no accompanying paper tracing. The most common method of data storage currently in use is the computer hard drive. Most systems save data first to a hard drive, then to a backup CD, DVD, removable hard disk, or tape storage system.
Data storage to the hard drive is standard and should occur in short segments at a rate of every two seconds or less. A typical 16-channel, eight hour polysomnogram recording requires 50–60 MB of storage space. Digital video requires additional storage space. A typical polysomnogram that includes digital video requires approximately 100 MB of storage space. Removable disk drives usually have more storage space readily available than the computer hard drive. Some removable disk drives (1–2 terabytes) may be capable of storing as many as 200 PSG recordings. When data is initially stored to the hard drive the data must be downloaded (copied) to a permanent storage medium, and the original data must be deleted to provide storage space for the next recording.
It is very important to ascertain that adequate storage space is available before beginning the PSG recording. Reliable data storage and the ability to consistently retrieve intact data for scoring and interpretation are essential. There are legal requirements that the medical record (the PSG) must be stored reliably and be accessible for a certain length of time. These factors must be kept in mind during handling and storage of digital PSG recordings.
Matching Questions—Basic Instrumentation:
