Lecture 3
Biopotentials
Understanding the generation of biopotentials from the human body and the principles of recording these biopotentials is essential to the performance of polysomnography. Electrical activity (biopotentials) generated by neurons in the brain produce the EEG; electrical potentials generated by changes in corneoretinal potentials with eye movement produce activity recorded as the EOG; and electrical activity produced by muscle cells generates EMG activity. These biological signals are recorded directly from the body using electrodes attached to the scalp and skin.
The EEG recording amplifies the brain's electrical signals to provide a graphic display of the brain's activity. These signals are generated by neuronal activity in the brain. It is the core measurement of polysomnography.
Electroencephalogram activity consists of a combination of several different sinusoidal waveforms of specific frequencies of interest that have a measurable amplitude. Brainwave frequencies are expressed as cycles per second, or Hertz (Hz). Brainwave amplitude is expressed in microvolts, or µV (this is one millionth of a volt—a very small signal).
The frequencies of interest are categorized by frequency as delta activity (4 Hz or less), theta activity (5–7 Hz), alpha activity (8–13 Hz), and beta activity (greater than 13 Hz). See figures 3.1–3.4 for examples. These frequencies form patterns of activity that are classified as sleep/wake stages based on frequency, amplitude, and location on the scalp. Most of the EEG activity of interest is within 0.5–25 Hz and is therefore recorded with filter settings of 0.3–35 Hz. These signals generally range between 10 and 200 µV in amplitude. They require significant amplification and are usually recorded with a sensitivity of 5 µV/mm. The complexity of the signal requires a minimum sampling rate of 200 and is best recorded at a sampling rate of 500 Hz.
Figure 3.1. Delta waves.
![]()
Figure 3.2. Theta waves.
![]()
Figure 3.3. Alpha waves.
![]()
Figure 3.4. Beta waves.
![]()
The electrooculogram recording is based on the small electrical potential difference between the front of the eye (cornea—more positive) and the back of the eye (retina—more negative). Changes in the location of the cornea and retina in relation to the electrode produce the electrical potential that is recorded as eye movement (see fig. 3.5). Both vertical and horizontal eye movements will produce a measurable electrical potential on the EOG recording channels.
Figure 3.5. An illustration of the electrooculogram (EOG) signal generated by horizontal movement of the eyes. The polarity of the signal is positive at the electrode toward which the eye is moving.
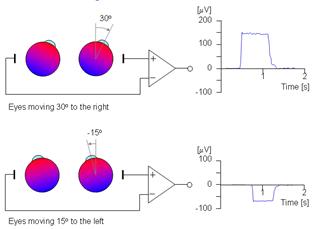
The signal of interest encompasses both slow and rapid movements that occur within the frequency range of 0.2–10 Hz. These potentials are best recorded with filter settings of 0.3–35 Hz and a minimum sampling rate of 200 Hz. The EOG generally records background EEG activity as well as EOG movements, and for this reason a sampling rate of 500 Hz is generally used. These signals are amplified similarly to EEG signals, although the eye movements themselves produce a much higher amplitude (–30 to –40 millivolts) signal than EEG activity that stands out from the background EEG activity.
An EMG is recorded from electrical activity generated by neuronal activity in the muscles on, and beneath, the chin (mentalis and submentalis muscles) and from muscles on each lower leg at the anterior tibialis muscle as a measure of muscle tone and movement. Electromyogram activity ranges between 15 and 90 Hz and is recorded with filter settings of 10–100 Hz. Electromyogram signals are amplified at approximately half the amplification necessary to record EEG signals. Amplification is variable for this signal and is based on underlying muscle tone. Voluntary movement produces high amplitude signals. The minimum sampling rate for recording EMG activity is 200 Hz, but a sampling rate of 500 Hz is recommended to improve resolution of this very fast activity.
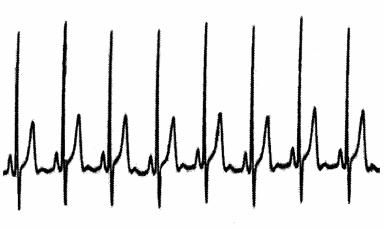
An electrocardiogram records the electrical activity of the heart. The EKG signal is a high voltage (–60 to –90 millivolts) signal (see fig. 3.6) in comparison to most of the other biological signals recorded during polysomnography and requires much less amplification. This signal often can be seen as an artifact or unwanted signal on other recording channels, particularly the EEG and EOG. The EKG is a complex signal that includes activity between 1 and 50 Hz and is recorded with filter settings of 0.3–70 Hz to accommodate both the slow and fast components that make up this signal. The minimum sampling rate for recording EKG activity is 200 Hz, but a sampling rate of 500 Hz is preferred to improve resolution of this important signal.
Figure 3.6.
A number of the standard parameters recorded during polysomnography are obtained using transducers. Transducers convert physiological activity into electrical signals and are used to collect and record respiratory effort and airflow activity, movement, and snoring. Other signals are obtained using ancillary equipment that is interfaced with the polygraph. All ancillary devices are input to the polygraph via either an AC or a DC amplifier and are filtered as necessary to provide a usable recording of the desired parameter.
Thermocouples and thermistors are the most common sensors used to detect airflow in polysomnography. The thermistor consists of a temperature sensitive resistor that is supplied with a constant amount of low current. The use of low current reduces the tendency of the sensor itself to heat up. The thermistor produces a signal based on air temperature differences that occur with inspiration and expiration (see fig. 3.7). Inspiratory airflow cools the sensor to the temperature of ambient air and decreases resistance. Expiratory airflow heats the sensor to core body temperature and increases the resistance. Thermocouples generate their own voltage but otherwise operate in the same manner.
Figure 3.7. Thermal airflow signal.
![]()
Thermistors and thermocouples are designed to maximize the sensing area while remaining small enough to be unobtrusive at the airway. Because of this design, small changes in temperature produce large resistance changes, making the thermocouple or thermistor a very sensitive qualitative measure of airflow. Thermocouples are the most commonly used thermal sensors. Most combine two nasal sensors and one oral sensor into a small adhesive strip or bendable wire frame that is placed to record airflow from all three airways, recording an airflow signal on a single polygraph channel regardless of whether the airflow is originating from a nare, the mouth, or both.
The thermocouple uses dissimilar metals to generate a signal that responds to temperature differences and is output to an AC amplifier. The thermocouple is an easy-to-use, cost-effective, and noninvasive method of measuring airflow during sleep. Thermal sensors are typically interfaced with an AC polygraph amplifier via the electrode jackbox. Thermistors use an adapter that generates a small current to power the transducer and generate a signal that responds to temperature differences and is output to an AC amplifier.
The most common problem with thermal sensors is signal loss. This is usually due to the sensor touching the skin. When the sensor is touching the skin, it registers the patient's body temperature and no longer records an airflow signal. Thermal sensors are not generally used during CPAP titration owing to the likelihood of signal loss at higher CPAP levels. The large amount of cool airflow within the CPAP mask during titration makes it difficult for the sensor to detect the temperature change that occurs with exhalation.
Since the respiratory cycle is slow (20 breaths per minute equals 0.33 Hz), the polygraph filters must be adjusted to record a slow signal accurately. An HFF setting of 15 Hz and an LFF setting of 0.1 Hz provide an accurate representation of the thermal airflow signal. The sensitivity is adjusted, during montage calibrations, to provide an adequate signal without channel blocking. The polarity is adjusted to result in an upward signal deflection with inspiration and a downward signal deflection with expiration. During patient calibrations, the patient is asked to hold his breath for a minimum of ten seconds to simulate cessation of breathing and ensure that the signal falls to baseline with no airflow.
Pressure transducers are used as a measure of respiratory airflow during diagnostic polysomnography and during CPAP or bilevel titration. Nasal cannula pressure transducer systems use a differential pressure transducer to represent changes in respiratory airflow exchange. Limitations in respiratory airflow are represented by changes in the contour of the inspiratory airflow waveform (see fig. 3.8). During normal respiration, inspiration produces an airflow waveform with a rounded (sinusoidal) peak. Restriction of respiratory airflow produces a flattening or plateau on the contour of this peak. Therefore, changes in airflow can be deduced by changes in the morphology of the waveform.
Figure 3.8. Pressure transducer airflow signal.
The changes in pressure inside the CPAP mask that occur with inhalation and exhalation are measured using a differential pressure transducer located in the CPAP or bilevel instrument. This pressure transducer is built into the instrument and measures pressure differences within the CPAP mask. These changes in pressure can be output from the CPAP instrument to the polygraph as a respiratory airflow signal. This signal generally replaces the pressure transducer signal as a measure of airflow during CPAP and bilevel titrations. The polygraph interface, filter settings, and calibration measures used for this type of airflow monitor are the same as those described for thermocouples and thermistors.
There are numerous methods to measure respiratory effort, including:
• respiratory inductance plethysmography (RIP)
• impedance pneumography
• strain gauges
• piezoelectric crystal belts
• intercostal EMG recording
• esophageal pressure monitoring (Pes)
Only esophageal pressure monitoring (Pes), using an esophageal pressure transducer, can directly measure respiratory effort. All other methods are indirect measures of respiratory effort. The only currently approved measures for measuring respiratory effort are calibrated or uncalibrated respiratory inductance plethysmography (RIP) or Pes.
Respiratory inductance plethysmography (RIP) measures relative changes in the cross-sectional areas of the thoracic cavity between the rib cage and abdominal areas. An insulated wire is sewn into respiratory belts in a horizontal sinusoid fashion. These belts are placed around the thorax and abdomen (see fig. 3.9). A constant small amount of current is passed through the insulated wire, which changes in shape with respiratory effort. Measuring the changes in current flow in the conductor produces the signal (see fig. 3.10), which occurs with changes in the cross-sectional areas of the rib cage and abdomen during respiration.
Figure 3.9.
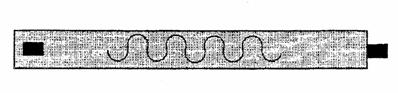
Figure 3.10.
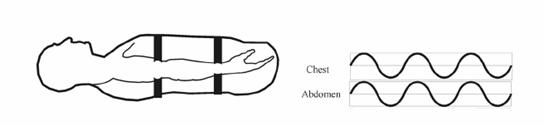
The thoracic belt is placed at the level of the axilla, and the abdominal belt is placed just above the iliac crest (see fig. 3.11). Each belt is interfaced to the polygraph amplifier. An HFF setting of 15 Hz and an LFF setting of 0.1 Hz are used to provide an accurate representation of the effort signals. The sensitivity is adjusted so that the signal provides an adequate signal without channel blocking. The polarity is adjusted to result in an upward signal deflection with inspiration and a downward signal deflection with expiration. Typically, the signal is calibrated for each patient at the beginning of the recording period during a period of relaxed wakefulness when the patient is demonstrating fairly regular breathing. During patient calibration, a ten second breath hold is used to simulate cessation of breathing and ensure that the signal falls to baseline with no respiratory effort.
Figure 3.11.
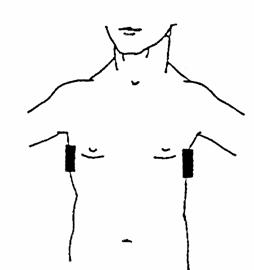
Impedance pneumography measures changes in impedance across a conductor, thus producing an effort signal. A pair of electrodes is placed so that they are positioned across from each other at the area of maximum thoracic effort, usually at the level of the axilla (see fig. 3.12). A small amount of current is passed across the thorax via the electrodes, and changes in thoracic impedance that occur with variation in the amount of nonconductive material (air) present produce a recordable signal. Amplifier settings are similar to those used for most respiratory effort signals: HFF 15 Hz and LFF 0.1 Hz, and sensitivity is adjusted to provide an adequate signal without channel blocking. The polarity is adjusted to result in an upward signal deflection with inspiration and a downward signal deflection with expiration.
Because changes in both conductive and nonconductive materials between the electrodes may affect the impedance, a precise measurement of respiratory volume and pattern is not always possible. In addition, electrical interference can be a problem with this method of respiratory effort measurement. Impedance pneumography is rarely used as a measure of respiratory effort for clinical polysomnography in adults. However, some laboratories routinely use impedance pneumography in infant recordings.
Figure 3.12.
Esophageal pressure monitoring (Pes) uses a transducer connected to a small-bore esophageal catheter to measure esophageal pressure and inspiratory respiratory effort. In patients with central apnea, this method is sometimes used to definitively document the absence of respiratory effort. It can also be used to document upper airway resistance. Amplifier settings are similar to those used for most respiratory effort signals: HFF 15 Hz and LFF 0.1 Hz. Since this is an invasive method, involving placement of a catheter in the esophagus, this type of monitoring is rarely used in a clinical setting.
In the early days of polysomnography, strain gauges were the most commonly used method for detecting respiratory effort. A strain gauge consists of a sealed elastic tube filled with a conductor (usually mercury) through which a small electric current is passed. The tube is usually sewn into an elastic belt, which is placed around the thorax or abdomen. The strain gauge may also be taped to the chest or abdominal wall instead of sewn into a belt. Stretching the gauge, which occurs with inspiratory effort, produces an increase in resistance to the applied current, while exhalation results in a decrease in resistance. These changes produce a qualitative respiratory effort signal on the polygraph.
The amount of stretch in a strain gauge is a factor in its operation. Overstretching the gauge when it is applied results in a high level of resistance, while an understretched gauge may not produce a measurable change in resistance. In either case, the signal recorded will not reflect the actual changes in gauge length. A correctly sized and placed strain gauge must be taut, but not overstretched, in order to produce a reliable signal. Amplifier settings are similar to those used for most respiratory effort signals: HFF 15 Hz and LFF 0.1 Hz, and sensitivity is adjusted to provide an adequate signal without channel blocking. The polarity is adjusted to result in an upward signal deflection with inspiration and a downward signal deflection with expiration.
Strain gauges are not quantitatively calibrated and are no longer approved for measuring effort during polysomnography. The currently accepted methods for detecting respiratory effort are calibrated and uncalibrated respiratory inductance plethysmography and esophageal pressure monitoring (Pes). Calibrated respiratory inductance plethysmography provides the ideal respiratory effort signal.
Piezoelectric crystal belts were developed in the 1990s and replaced strain gauges as the standard means of measuring respiratory effort for a period of time. These belts use the same principles of operation as strain gauges. The piezoelectric crystal is ground to a film and generates its own electrical signal, similar to a thermocouple. The use of piezoelectric crystals, in place of the mercury strain gauge, resulted in a more stable signal and far fewer problems related to placement, overstretching, and understretching. These belts, however, have an inherent tendency to record false "paradoxing" (opposing phases of respiration between thoracic and abdominal signals) following a position change, especially a change from back to side.
The crystal sensor is generally attached to an elastic belt, and belts are placed at the abdomen and thorax. Alternatively the crystal sensor can be taped in place on the skin at the level of the thorax and abdomen. These sensors interface with the polygraph via the jackbox and AC amplifier. Amplifier settings are similar to those used for most respiratory effort signals: HFF 15 Hz and LFF 0.1 Hz, and sensitivity is adjusted to provide an adequate signal without channel blocking. The polarity is adjusted to result in an upward signal deflection with inspiration and a downward signal deflection with expiration.
Because of their ease of use and durability, these gauges were the standard method of recording respiratory effort for polysomnography for many years. Piezoelectric crystal belts are not quantitatively calibrated, and are no longer approved for measuring respiratory effort during polysomnography.
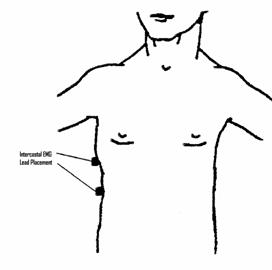
An intercostal EMG recording can be used as an adjunct method of detecting respiratory effort. A pair of electrodes is placed over the intercostal muscles on one side of the body to record the muscle activity seen with respiratory effort (see fig. 3.13). This signal is an inadequate measure of respiratory effort if used alone, but may provide valuable information regarding increased respiratory effort occurring with partial or complete respiratory obstruction occurring during sleep. The pair of intercostal electrodes is interfaced to the polygraph via the jackbox and an AC amplifier, using filter and sensitivity settings appropriate for an EMG recording. An EKG signal is frequently seen as an artifact on intercostal EMG recordings and usually cannot be eliminated. However, this does not generally interfere with interpretation of the EMG signal. The amplifier settings used to record intercostal EMG are similar to those used for other EMG signals: HFF 100 Hz, LFF 10 Hz. Sensitivity is generally set in the range of 20 μV/mm and adjusted as needed during patient calibrations.
Figure 3.13.
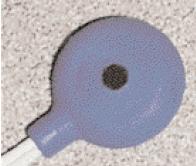
Snoring microphones or snoring sensors (see figs 3.14 and 3.15) are used to provide a qualitative measure of snoring. These miniature microphones or snoring sensors are placed on the neck adjacent to the trachea and produce a recordable signal on the polygraph in response to either snoring noise or vibration, depending on whether a microphone or sensor is used. These devices are not a measure of airflow or effort; they are used to verify the presence or absence of snoring. One very useful application of a snoring microphone or sensor is to verify the absence of snoring during CPAP or bilevel titration, as a confirmation that partial airway obstruction has been eliminated. The only true measure of upper airway resistance is the esophageal pressure transducer, which is rarely used in clinical practice.
Figure 3.14.
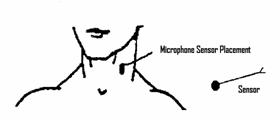
Figure 3.15. Snore microphone.
The devices described here are the most common standard sensors used to collect physiological signals during polysomnography. Numerous additional physiological signals can be recorded and interfaced with the polygraph. A thorough understanding of polygraph instrumentation will help you to decide how to interface any sensor you might want to use.
Matching Questions—Signal Frequencies:

Matching Questions—Respiratory Sensors: